Three pieces of good news broke in Asia last week that, although not providing an immediate impact on global airline capacity - will in the coming weeks help several airlines and airports in the region rebuild capacity.
Of course, pressure will be building for China to relax its travel restrictions as Japan removes visa requirements, Hong Kong ended mandatory Covid-19 hotel quarantine for international arrivals, and Chinese Taipei relaxes regulations. This has to be a good news week in Asia.
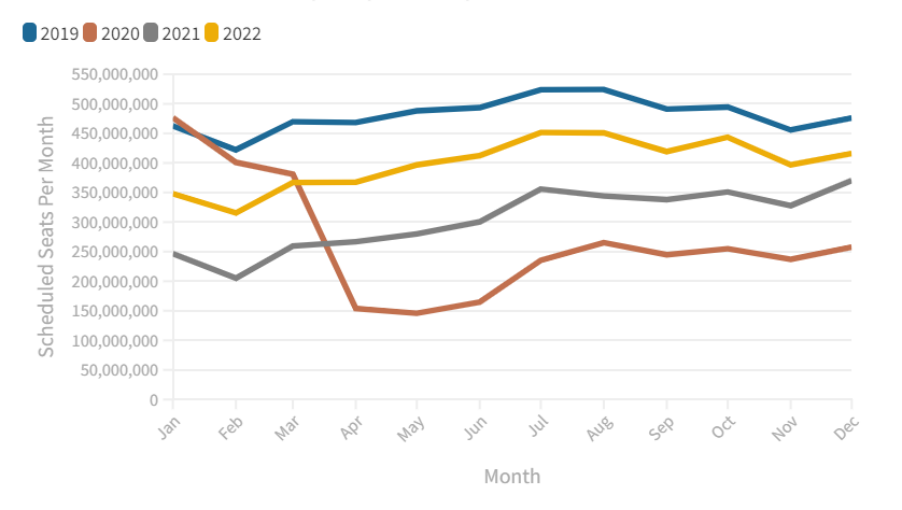
As September comes to an end and the shops begin to fill with Xmas cards and other such seasonal delights we’ve added December to the rolling three-month forward-capacity chart! We can now see how the year-end is shaping up , allowing for the inevitable shaving of capacity by carriers up to a few weeks before departure, it looks like we will have more than 4.5 billion seats in 2022 - a 24% increase on last year and around 72% of the 2019 capacity. That may seem slightly disappointing, but the last six months of the year are tracking at 87% of the 2019 capacity so edging ever closer to historic levels. And that’s before the three Asian markets (mentioned before) have added back airline capacity.
Chart 1 - Scheduled Airline Capacity - Three Months Forward-Looking

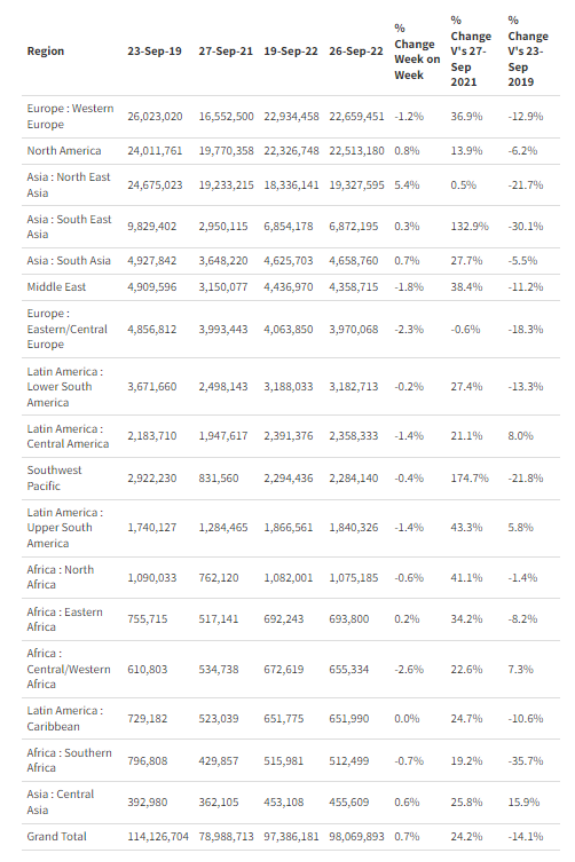
Looking at the more immediate flight data this week, airline capacity has nudged back above 98 million with a further 680,000 seats added (with North East Asia and the regular weekly optimism of lockdowns being eased in China accounting for that increase). Western Europe has managed to hang onto its position as the largest market in the world - but, in all likelihood, will relinquish that position to North America next week and probably for the rest of this year and first half of next. Two of the weakest performing markets compared to 2019 airline capacity are South East Asia (-30%) and North East Asia (-22%), who will undoubtedly benefit from the announced changes in entry requirements.
Table 1 – Scheduled Airline Capacity by Region

Source: OAG
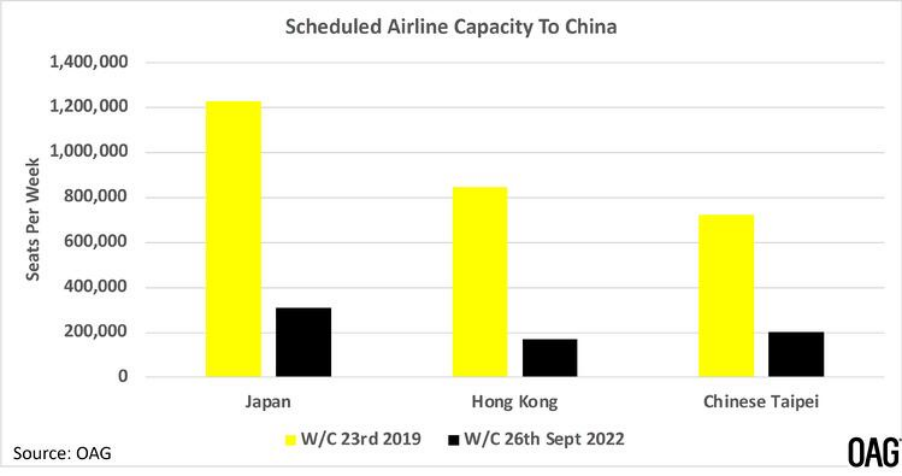
With the announced reopening of three Asian markets last week, we have looked at the remaining issue in their recoveries - access to China and one of their major international markets. In the chart below we show the scheduled capacity from each country to China for each market and the scale of capacity gap that continues to exist. As can be seen, the good news is good news, however there is still a long journey in terms of capacity to be recovered. Japan currently has just 2.5% of its international capacity operating to China compared to a normalised level of 20.0% and Chinese Taipei stands at around 8.5% of its capacity to China’s mainland being operated compared to a normal 19% mark. All of which begs the question: when will the final good piece of news come from China that will change the pace of recovery for every market in the region, sooner or later?
Chart 2 – Scheduled Capacity To China From Reopening Asian Markets


